
Research
The Lawson Lab addresses important questions about the genotype – phenotype relationship that must be answered to understand variation in metabolic traits. Specifically:
- Are particular metabolic traits more genetically or epigenetically controlled?
- How does diet affect the relative contribution of genetics or epigenetics?
- Do differences in genetic and epigenetic modes of regulation result in discordance among metabolic traits?
Answers to these questions are critical to understanding why some individuals with metabolic complications respond to lifestyle modifications while others require therapeutic interventions. Further, understanding how diet modifies genetic and epigenetic effects might shed light on why some obese individuals develop metabolic complications while others remain metabolically healthy.
We have found that the modes (genetic or epigenetic) of regulating genes underlying variation in metabolic traits vary depending on environment rather than being universal. We aim to characterize the genotype-phenotype relationship using a model system, and then translate our results to human studies.
Parent-of-Origin Effects
Parent-of-origin effects occur when the phenotypic effects of an allele depends on whether it is inherited from the mother or the father. We have found prevalent complex parent-of-origin effects on dietary obesity-related metabolic traits. One of our main research goals is to understand the molecular mechanisms that generate these complex phenotypic patterns.
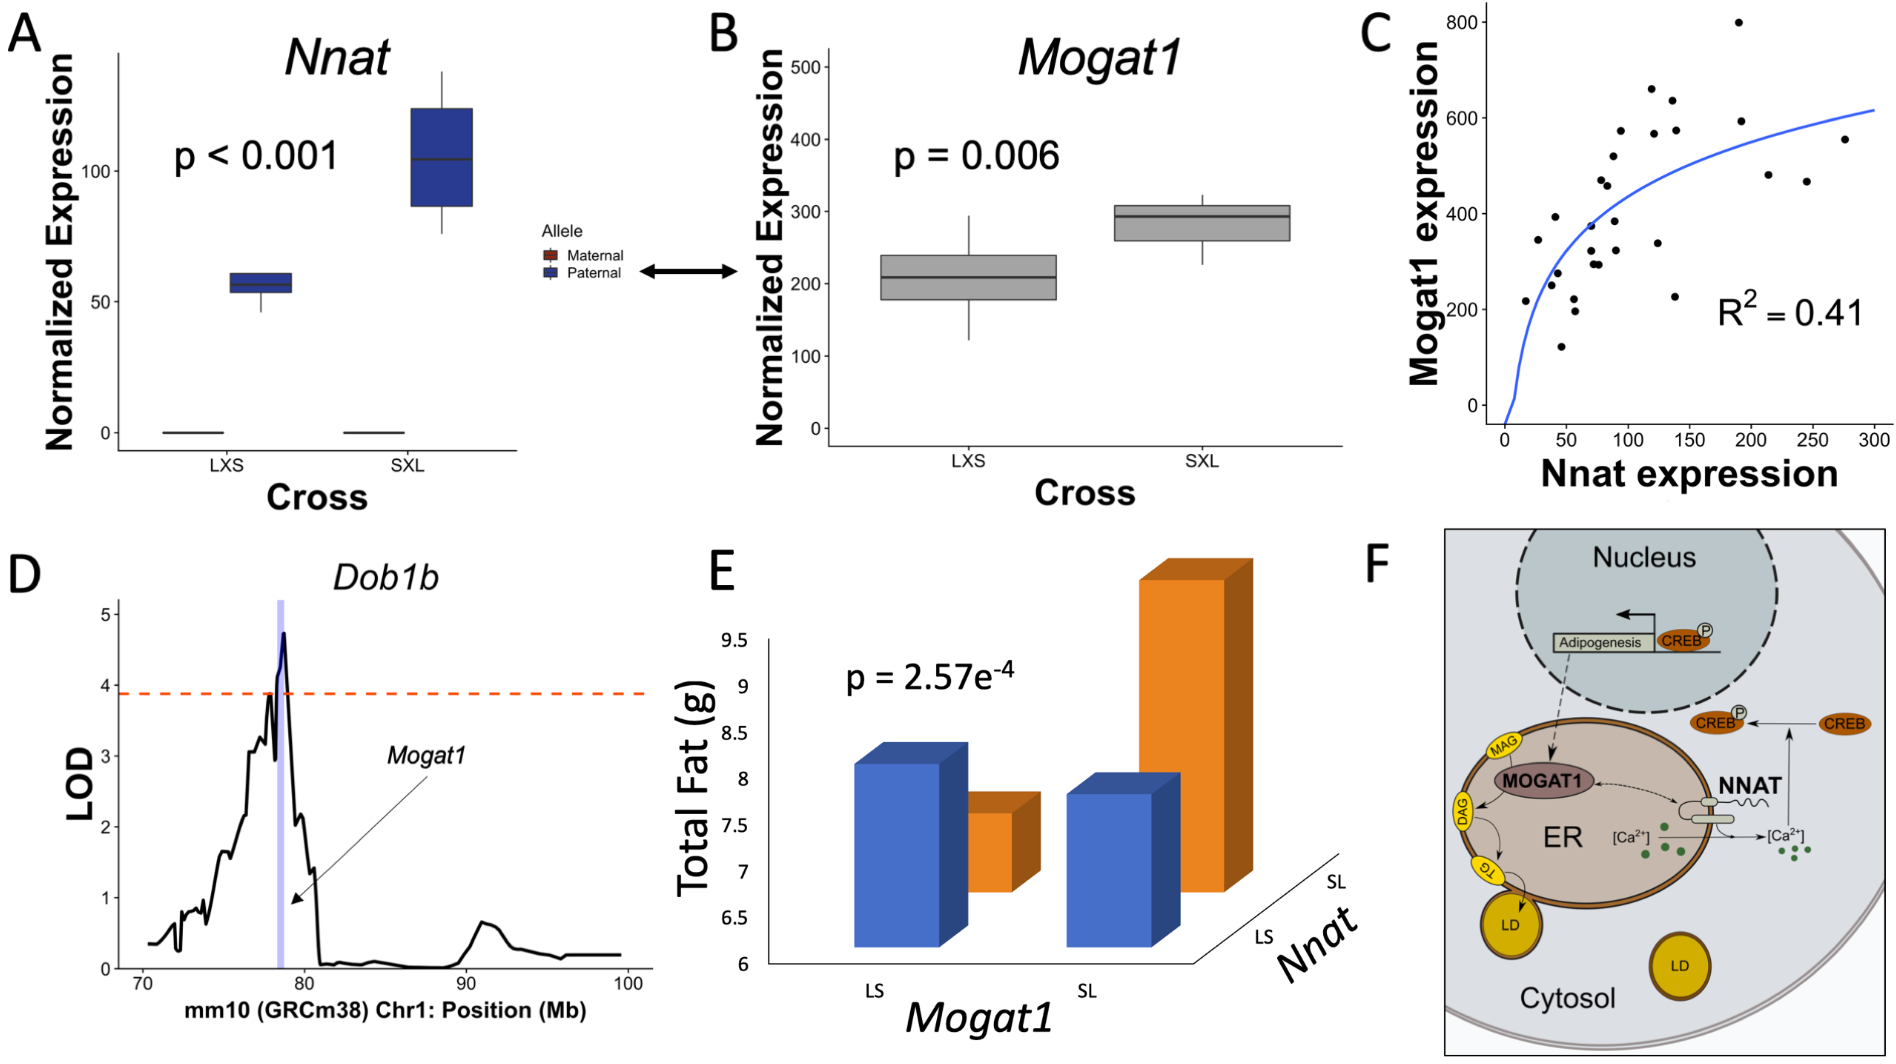
Interaction in white adipose between the imprinted gene Nnat and the non-imprinted gene Mogat1. (A) We identified Nnat as an imprinted gene showing paternal expression. (B) Mogat1 was identified as a non-imprinted gene showing differential expression between reciprocal crosses of mice (LxS versus SxL), and (C) found to significantly covary with Nnat. Logarithmic regression was performed by fitting the function Mogat1~ln(Nnat). (D) Mogat1 falls in a QTL for multiple adiposity traits identified in an F16 LGxSM advanced intercross. (E) Targeted epistasis mapping in the F16 shows significant epistasis between Nnat and Mogat1 for inguinal fatpad and total fat. Heterozygote mice expressing the paternal LG/J-derived allele (SL) at Nnat have the highest total fatpad weight when they have the SL genotype at Mogat1. (F) Nnat and Mogat1 both localize to the endoplasmic reticulum in adipocytes and contribute to adipose function.
The Brown Adipose – ß-cell Axis in Normoglycemic Obesity.
We are leveraging a novel mouse model to understand glucose regulation in obesity. On a high fat diet, our mice initially develop the classic hallmarks of hyperglycemia, including impaired glucose tolerance and elevated fasting glucose. Strikingly, these abnormalities resolve spontaneously by 30 weeks of age despite persistence of the obese state. A prominent phenotype of these mice is that they dramatically expand their interscapular brown adipose depots and pancreatic islets while increasing insulin production as they resolve their glycemic dysfunction.
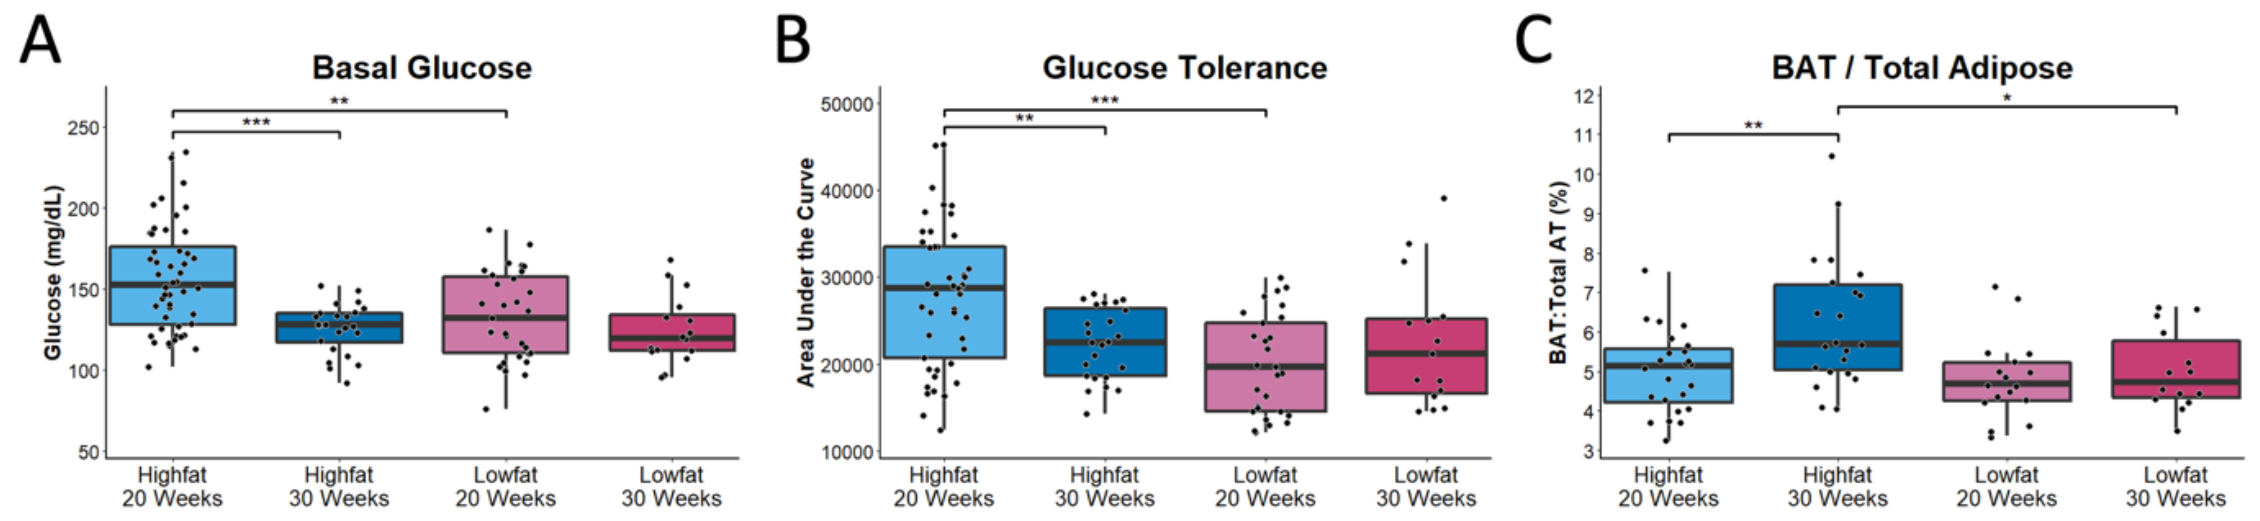
High fat-fed mice resolve their hyperglycemia and expand their brown adipose depots. (A) Basal glucose levels from high and low fat-fed mice assessed via glucometer. (B) Area under the curve of a glucose tolerance test via intraperitoneal glucose injection. (C) Brown adipose tissue depot size as a proportion of total fat mass. Brown adipose tissue depot mass determined by excision at necropsy, total fat mass assessed via MRI. Data from males and females at 20 weeks and 30 weeks. n >15 per cohort. All parameters collected after 4-5 hour fast. Statistical significance assessed via 1way ANOVA with Tukey’s post hoc multiple comparisons test. ***p<0.001; **<0.01, *<0.05
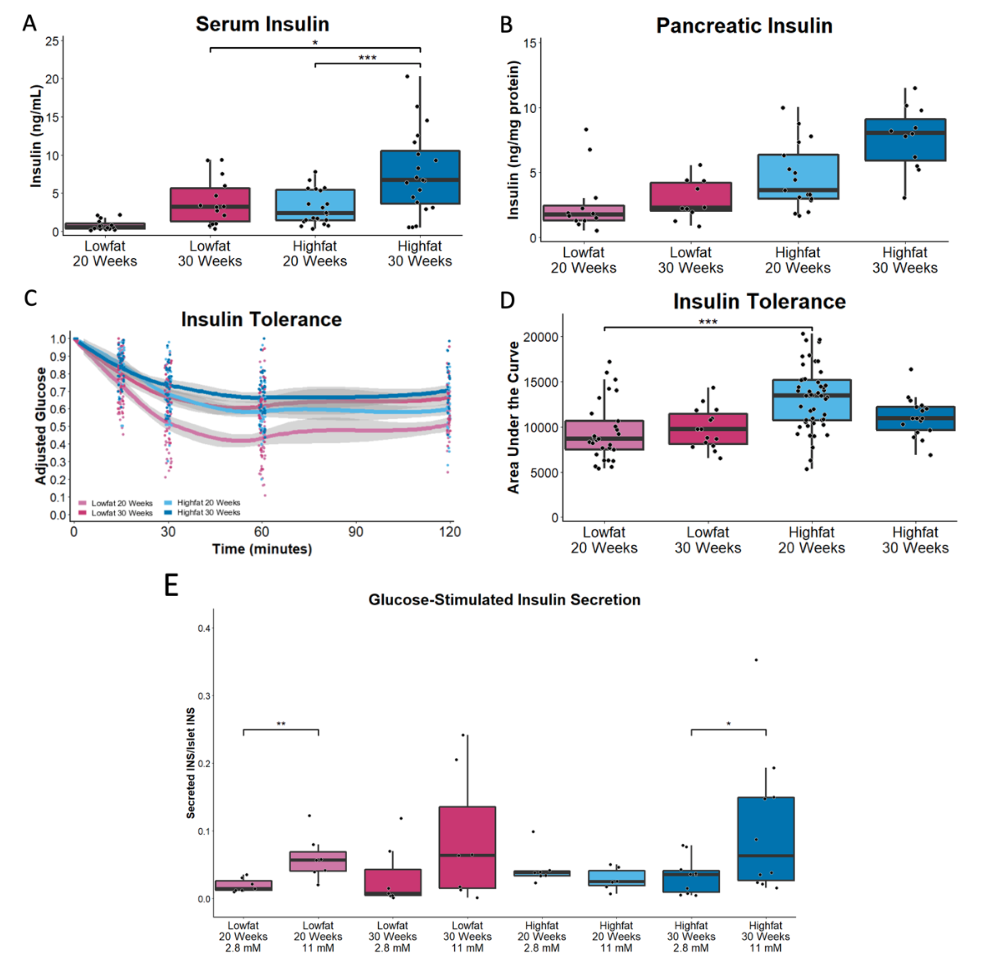
Remission of hyperglycemia corresponds with increased insulin production and improved islet function. (A) Improved glucose parameters in high fat-fed 30 week-old animals correlates with increased circulating insulin levels and in (B) pancreatic insulin. (C and D) This is not accompanied by a decrease in insulin sensitivity as assessed by an insulin tolerance test and quantified by area under the curve. (E) Islets isolated from high fat-fed 30 week-old animals show restored insulin secretion capacity in the presence of high glucose compared to high fat-fed 20 week-old animals. Statistical significance assessed via 1way ANOVA with Tukey’s post hoc multiple comparisons test for A-D, n > 8 per cohort. Student’s t-test used to assess statistical significance between low (2.8 mM) and high (11 mM) glucose in E, n = 6-8 per cohort. ***p<0.001; **<0.01; *p<0.05